Airflow resistance of sugar beets
30.04.2018 | Beets

This article describes an experiment which was carried out in the natural environment. During the experiment, the most important information was written down. You can find aeration equipment for piles, examples of our projects in Russia on our website.
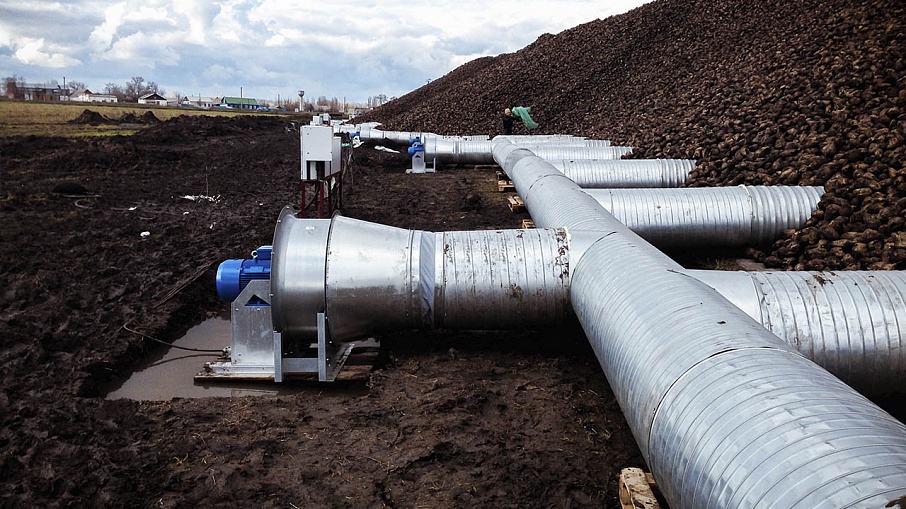
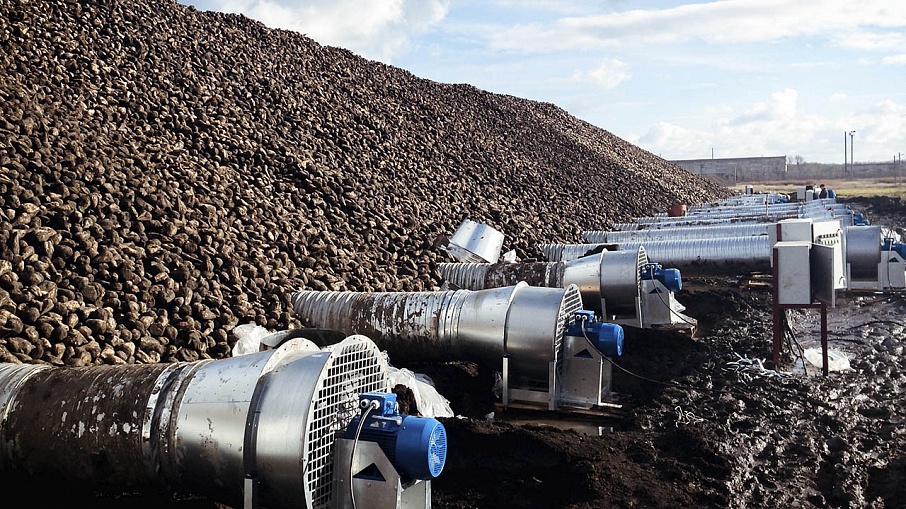
When forced blowing is used, the undamaged state of sugar beet piles increases by 50-70% and, depending on the project, gives an opportunity for full cost recovery within one or two years.
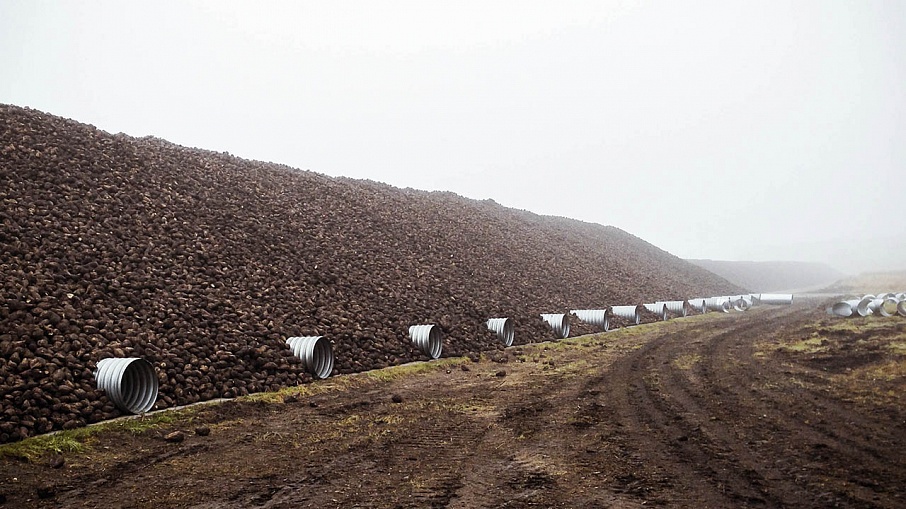
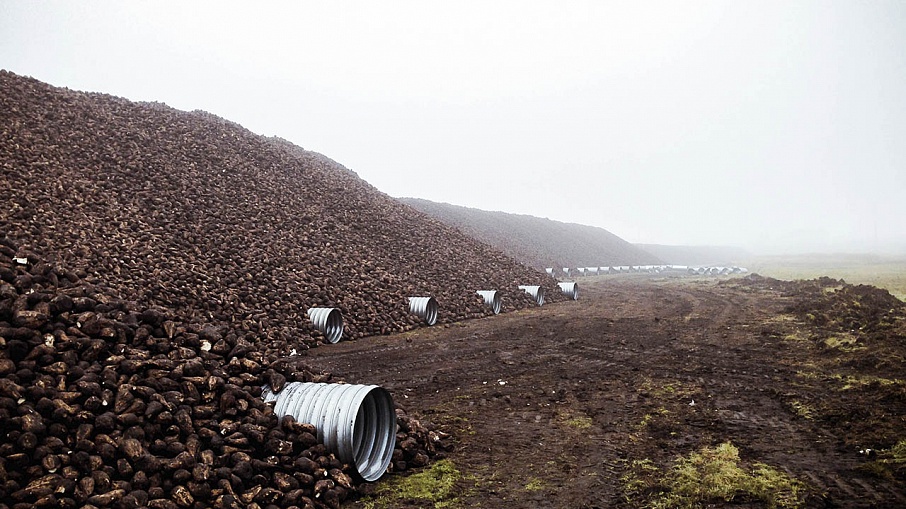
In Alberta, Canada, sugar beets are kept in big piles in the open air before processing. If piles are not ventilated, they sometimes begin to rot from the inside. Airflow resistance data is important for forecasting air flow evenness and for developing the appropriate air ventilation system. As a result, equipment for measuring the airflow resistance of sugar beets was invented and produced. Sugar beets were divided into three groups: less than 1200 g, more than 1200 g and mixed beets. In the research, piles were studied with both root crops and root crops with foreign bodies. The mass of these foreign bodies was from 4.4 to 8.5% relative to the mass of the pile/root crop. The following airflow rate numerical values were used: 0.01, 0.02, 0.04, 0.06, 0.08, 0.1, 0.3. and 0.5 m3/sec/m2. The measurement of air flows was done vertically and horizontally with the help of a container. The bulk density and root texture of sugar beets influences airflow resistance. Two models of resistance were determined. Little root crops showed resistance which was 1.9 times higher compared to bigger root crops. Foreign bodies in root crops caused higher resistance to the flow of the air.
Sugar beet is the main crop plant in the southern part of Alberta, Canada. In 1999 and 2000, 839 773 tons and 920 252 tons of beets were collected, respectively. It is necessary to store beets before their cultivation because of the short period of collecting crops and limited prospects for cultivation. Crops are usually put into storage at the end of September and this continues in October. Crop cultivation begins right away and continues until February or March, or until all crops are cultivated. Crops are kept for 120 days or more, depending on the speed of cultivation and the size of the crop.
The loss of beets during storage depends on many factors, including the time of storage, temperature of root crops, environmental temperature and the extent of mechanical and frost damage. Peterson and others (1987) calculated that beets lose from 0.15 to 0.25 kilograms of sugar per ton a day during storage. Forced air ventilation of piles is effective against the temperature rise caused by crop respiration in piles. Ventilation reduces temperature and, as a result, significantly decreases losses during storage. It was shown (1952) that sugar loss was reduced by 50% when piles were ventilated at approximately 0.005 m3/sec/ton (10 lb3/min/ton). Nevertheless, the installation of ventilation systems in Alberta was limited. Company expenses associated with the installation and use of a ventilation system should be offset by the reduction of storage losses.
Areas of bad airflow distribution is a common problem in a ventilated room. Such areas tend to heat up (hot spots) and, as a result, lead to rotting. Holdredge and Weiss (1982) confirmed that, as a rule, hot spots appear in places where the flow of air is limited. They found that soil and foreign bodies on root crops in storage are the reason why hot spots appear.
The evenness of airflow distribution in a pile can depend on the size and shape of the beets, the variability of directed resistance as determined by the shape of root crops and type of storage, and the amount of soil on the surface of the beets. Irvin and others (1993) studied the influence of the factors mentioned above on the airflow resistance of potatoes. Airflow resistance was equal to 41% of the resistance of smaller potatoes. Mellow soil increases airflow resistance in a vertical position.
Nil and Messer (1976) defined the airflow resistance of onions, carrots and potatoes and arrived at the conclusion that soil on the surface of crops has a greater influence on airflow resistance than differences in the physical features of crops. Nevertheless, Small and Hodgikson (1989) noted that soil (5%) in a potato tuber did not have any influence on changes to static pressure in the round air flues of ventilation systems, but had an insignificant effect in semi-circular air flues.
As a tool for defining ventilation requirements, this research helped to study changes in pressure and airflow characteristics in ventilated piles of sugar beets. Airflow resistance is necessary for forecasting airflow distribution in a ventilated pile and for defining the requirements for fan power.
The goal of the research was to define the airflow resistance of sugar beets, to study the influence of root crop sizes, soil and foreign bodies in piles and the influence of airflow direction on the airflow resistance of beets.
MATERIALS AND METHODS
Selection of specimens for the research
Sugar beet specimens were selected from freshly-harvested crops in Taber, Alberta in October 1998. The sugar beets were grown in irrigated areas in the vicinity of Taber. The average weight was approximately 1200g. For the experiments, the beets were sorted by weight: a) less than 1200g (small root crops); b) more than 1200g (big root crops); c) mixed root crops. Soil was removed from the surface of the selected root crops. Selected root crops were arranged as follows: a) big - into four wire containers; b) small - into four wooden containers; c) mixed - into three wooden containers. Each container contained approximately 900kg of beets. A wooden container was filled with foreign bodies (soil, stones, parts of plans). This material was sent to Edmonton for storage and testing. Before testing, root crops were kept in a room at -9 С.
Equipment for measuring airflow resistance
Figure 1 shows a device for measuring the airflow resistance (pressure drop) of sugar beets. The device consists of a fan, air circuit and container where the beets are stored. Root crops were separated with metal gauze, which was 6.4mm in diameter and had square holes (19mm). The container filing and air circuit, which is 406mm in diameter, are connected with the help of a transition whose shape changes from rectangular to circular with a convergence angle of 60°. One of the tanker walls could be taken off for cleaning and filling. The removable wall was divided into four sections: each section could be either removed or left in order to make loading and unloading easier.


Figure 1. Equipment for measuring the airflow resistance of beets. (a) Vertical airflow. (b) Horizontal airflow
The device was painted both inside and outside. The sealing system was switched on in order to prevent air leaks around each section. All of the walls of the container were covered with polyethylene with closed pores, 25.4mm in thickness. Silicone sealer was also used around the inside perimeter. The internal dimensions of the container were one meter wide, one meter long, and two meters high. During vertical airflow testing (fig. 1(a)), the top part of the container was opened. The air flew through the bottom part of the container.
The container was designed and fabricated in such a way that could measure horizontal airflow resistance as well (fig. 1 (b)).
The removable wall was the best innovation of this device. During the research, the wall was removed and polyethylene film was used to cover the beets. The removed wall, made of metal gauze, was installed opposite the fixed side. Such a configuration lets the fan function when the pressure is negative. This triggers the sealing action of the polyethylene film and prevents airflow through the available surface over the beets.
Airflow and measuring control
Airflow was generated by a centrifugal blower with a 4 kW drive. Air circuit diameter - 406.4mm. Airflow was measured with trimmed stops (Jorgensen. 1983). Two of the stops were made from flat carbon steel 13.2mm in thickness and 0.35 and 0.60 mm in diameter for measuring airflow from 0.01 to 0.10 m3/sec/m2 and from 0.20 to 0.50 m3/sec/m2, respectively. Flange taps were installed at a distance as short as 25.4mm from each side of the stop in order to measure changes in pressure. The stop was located at the ten-diameter mark of the air circuit (4.1m) from the fan while checking vertical and horizontal airflow to provide direct airflow. If the pressure was over 124.4 Pa, it was measured with the inclined tube manometer Dwyer Model 125 AV (Dwyer Instruments Inc, Michigan City. PO). If the pressure was under 124.4 Pa, a pressure sensor was used (mode "PX 653-0.5D5 В, Omega Engineering. Inc. Stamford. KT) accurate within 0.25% of full scale (124.4 Pa is full scale). Cross section area of the container was 1m2.
Measuring of airflow differential
Static pressure at a distance of 0.5, 1.0, 1.5 and 2.0m from the top part of the container was measured for the following rate of airflow speed: 0.01, 0.02, 0.06, 0.04, 0.08, 0.10, 0.20, 0.30, 0.40, and 0.50 m3/sec/m2. Since the pressure drop at low speeds of airflow was insignificant, they made a container which was two meters high for more accurate measurements.
Static and dynamic pressures that were less than 124.4 Pa were measured with a differential pressure gauge (PX 653 -.. 0.5D5V Omega Engineering Inc., Stamford, CT.). Pressure between 124.4 and 248.8 Pa was measured with the inclined tube manometer Der 125 AV (Dwyer Instruments Inc. Michigan City, Indiana) with a full scale of 248.8 Pa and at a pitch of 1.2 Pa. Pressure over 248.8 Pa was measured with the vertically-inclined manometer Dwyer 400-23 (Dwyer Instruments Inc. Michigan City, IN). The inclined part of the manometer is able to measure up to 547.4 Pa at a pitch of 5 Pa.
While testing vertical airflow, the system was operating under positive pressure. Clean root crops were loaded manually through the four sections of the removable wall of the container. The sections of the wall were put back as the amount of beets grew. Each part of the wall was leveled with foam in order to prevent air leaks. During unloading, the top section of the removable wall was removed first.
While testing horizontal airflow, the system was operating under negative pressure. The air circuit was placed in such a way that the stops were located at the ten-diameter mark of the air circuit from the container. The removable part of the tanker became the top part and the removable wall made from metal gauze was to be installed at the end of the container (the top part in the vertical position) so as to hold the beets in place.
As an experiment, foreign bodies were added gradually and evenly to the container full of beets. After having measured the air resistance, the foreign bodies were extracted and put into a wooden tanker
Trial design
Many factors were considered during the experiment: a) the size of the beets; b) foreign bodies; c) the direction of airflow. Airflow resistance was measured during the two simultaneous tests. The sizes of the beets: a) small; b) big; c) mixed root crops. The presence of foreign bodies was based on the value given by Rogers Sugar, which is 4-5% of the mass of the beets. Two levels of the presence of foreign bodies were studied: a) 0% (clean root crops); b) 4-5% for small and big root crops and 8.5% for mixed root crops. The experiments lasted for almost a month and by the time they started to measure the airflow resistance of root crops mixed with foreign bodies, the condition of the root crops and plant materials in the container had significantly deteriorated. Hence, the foreign bodies took up a smaller capacity. Because of the loss of moisture, the beets lost their weight as well, which shows that there were too many foreign bodies among the root crops. Directions of airflow: a) vertical; b) horizontal.
Measuring moisture and density
The presence of moisture in the beets used for measuring airflow resistance was determined by the oven method. Five specimens of beets from each group (mixed, small and big) were chosen randomly for determining moisture.
Each root was ground up separately in a blender. The mixture was divided into three parts: the weight of each specimen was 15g, and the rest was thrown away. Each specimen was dried in a mechanical convection oven at 75’C for 48 hours. The amount of moisture was recorded in percentage terms in relation to the mass of beets in normal condition. In this way, 15 measurements were taken for each type of beets (five types of beets, three specimens of each type).
Bulk density was determined every time the tanker was filled by weighing each root crop until the tanker with a capacity of 2m3 was filled. In the experiments with foreign bodies, their weight was also included in bulk density calculations. The density of root particles was determined by cutting the specimens so that they corresponded to a micrometric densimeter 1305, 135cm in size. By using a helium gas, the densimeter determined the skeleton capacity of the specimen. Particle density is the mass ratio of the skeleton capacity of a specimen in kg/m3. The texture (%) or capacity in percentage terms occupied by the air in the measuring tanker was calculated during each experiment from the particle density value and capacity density.
Analysis of airflow resistance
Two models were used in accordance with the data. The first model (1953) was presentedas follows:
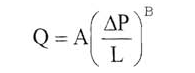
Where:
Q - airflow rate per unit area, m3/sec/m2
DP//L - pressure drop per unit depth, Pa/m
A, B - testing constants for each experiment
For reverse calculation, use following the equation:
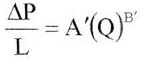
Where:
A¢, B¢ — testing constants for each experiment
The second model is described in ASAE D272.2 UIC 95 (ASAE. 1996). This model is able to calculate pressure drop per unit depth using the airflow speed per unit area:
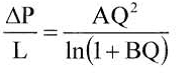
Where:
A, B - testing constants for each experiment.
Nonlinear regression procedure, PROC MAN from SAS (SAS, 1987) was used for the data fit of the model and data, and for determining A’ and B’ in an equation (2), and A and B in an equation (3).
RESULTS AND DISCUSSIONS
Measuring pressure drops at different spots of a tanker
During the tests on vertical airflow (fig. 2(a)), the pressure drop per unit depth was the greatest at the bottom of the tanker (PV2.0). The next point of high pressure drop was the point at a 0.5m distance (PV1.5). The pressure drop at the top part of the tanker (Pv0.5) turned out to be the lowest. Irvin and others (1993) reported a similar tendency for potatoes. They got the pressure value, starting from 0.7m at a 1m depth of the tanker. Changes in pressure at the given airflow speed could be associated with root crop compression at the bottom part of the tanker during the tests on vertical airflow. During the tests on vertical airflow, the Pv1.5 and Pv1.0 values were used in further analysis.
During the tests on horizontal airflow (fig. 2(b)), the Ph2.0, Ph 1.5 and Ph 1.0 values of pressure drop measured at 2.0, 1.5 and 1.0m distances from the removable wall made from metal gauze turned out to be the same for the mixed and small groups of beets. However, for bigger beets, the Ph1.5 value was higher than the Ph2.0 one, and the Ph2.0 and Ph1.0 turned out to be the same. Only the Ph0.5 value, measured at a 0.5m distance from the removable wall, was lower in all tests. Root crop compression was not obvious during the tests on horizontal airflow. The Ph1.5 and Ph1.0 values were used in further analysis.
Table 1 shows the average values of changes in pressure: Pv1.5 and Pv1.0 and Ph1.5 and Ph1.0 at a 0.55, 0.11 and 0.06 m3/sec/m2 speed. The coefficient of variation (CV) (the ratio of standard and average deviation) of the pressure-drop values varied from 0.48% to 18.43% at a 0.55m3/sec/m2 airflow speed. The CV varied between 1.63% and 27.92% at a 0.11m3/sec/m2 airflow speed and 3.92% and 46.05% at a 0.06m3/sec/m2 airflow speed. The CV increased when airflow speed was lower, indicating the increased variability of measurements of airflow resistance. Nevertheless, the CV values were similar to the CV Irvin et al. yielded (1993) for potatoes.


Figure 2. Pressure drop per unit depth for the mixed root crops where the amount of foreign bodies is equal to 0%.
Setting up a model for pressure-drop data
The given equations (2) and (3) were aligned with pressure-drop resistance with the aid of a non-linear regression analysis of the model. Estimates of the A’, B’, A and B constants, the coefficient of determination (R2) and the residual sum of squares (SS) for different specimens and testing conditions are shown in table 2. The R2 value varies from 0.96 to 0.99, indicating that both models correspond with the data.
SS values are similar for both models. Nevertheless, model 2 (Hakil and Yves, 1955; ASAE, 1996) demands the highest values of the B constant.

Figure 3. The correspondence of models 1 and 2 with the airflow
Physical features of sugar beets
Table 3 shows the physical features of the beets used in the research. As was previously discussed, the size of a beet was defined by average mass. The amount of moisture was similar, starting from 67.29% to 69.50%. Bulk density depended on whether the beets were clean and contained any foreign bodies. As a rule, small roots have high bulk density (682.00 and 722.45 kg/m3). The bulk density of big and mixed root crops is similar and varies between 635.00 and 714.75 kg/m3. Bulk density increases when foreign bodies are added. The values of the bulk density of root crops were also similar. The texture of clean root crops for each size was also the same, but lower for root crops with foreign bodies.
Impact of root crop size
The highest airflow resistance (pressure drop) was recorded for clean (free of foreign bodies), small and mixed root crops. The lowest resistance was recorded for big crops at a 0.55 m3/sec/m2 airflow speed (tab. 1). The airflow resistance of small root crops was 1.9 times greater than the big ones. This is because small root crops have a higher bulk density than other sizes.

Small root crops had the highest airflow resistance at its lowest speeds (0.11 and 0.06 m3/sec/m2). At a 0.11 m3/sec/m2 airflow speed, the airflow resistance of the mixed and big root crops did not differ significantly. Nevertheless, at a 0.06 m3/sec/m2 airflow speed, the resistance of big root crops was higher than the resistance of the mixed ones, which does not correspond with the tendency at higher airflow speeds.
Impact of airflow direction
The resistance of sugar beets to airflow was measured both vertically and horizontally. The possibility that resistance could depend on the direction of airflow had already been noted (1987).
Because sugar beets have an oblong root crop, it was decided to measure resistance in both vertical and horizontal directions. These values might come in handy during a simulation analysis of pressure patterns in sugar beet piles.
Table 1 shows the impact of airflow direction for mixed, small and big root crops without foreign bodies. The airflow resistance for each airflow speed was higher at a vertical airflow direction than at horizontal. Just the opposite was recorded (Irvin et al. (1993)) for potatoes. These differences are explained by the storage positioning of potatoes, in which the tuber is usually placed horizontally. There is no rule for the positioning of beets. A sugar beet is shaped like a double cone (with an interconnected short cone and long cone). During the tests on airflow resistance, the root crops were randomly placed in a tanker with no particular directionality. At a 0.55 m3/sec/m2 airflow speed, the resistance of root crops without foreign bodies was 52% higher in a vertical position than in horizontal. This can be explained with the help of density and texture values. During the tests on horizontal airflow direction for mixed, small and big root crops without foreign bodies, bulk density was higher and texture was lower than during the tests on vertical airflow direction. This means that in a tanker with the same capacity, the higher resistance of the root crops in a horizontal direction was caused by their high bulk density and lower texture compared to the vertical direction.
The airflow resistance values for small root crops (without foreign bodies) were similar for both vertical and horizontal airflows at low airflow speeds (0.11 and 0.06 m3/sec/m2). At a 0.55 m3/sec/m2 speed, the resistance in a horizontal direction was slightly higher (89.5 Pа/m), than in vertical (75.4 Pа/m). The bulk density of small root crops without foreign bodies was higher in a horizontal direction (687.5 kg/m3) of the airflow than in vertical (682.0 kg/m3). Unfortunately, it was impossible to reach the same bulk density in a tanker for each test in order to study the impact of airflow direction, which would have been ideal. Hence, the difference in airflow resistance between the horizontal and vertical directions depended on bulk density and texture.
Impact of foreign-body content
Foreign bodies such as soil, stones and parts of plants increase airflow resistance. Airflow resistance values for the root crops with foreign bodies were 1.3 - 2.6 times higher than for the clean ones at a 0.55 m3/sec/m2 flow speed. The values of airflow resistance for root crops with foreign bodies at a 0.11m3/sec/m2 flow speed were 1.06 - 3.75 times higher than for the clean ones.
The values of airflow resistance for root crops with foreign bodies at a 0.06m3/sec/m2 flow speed were 1.1 - 6.8 times higher than for the clean ones. The airflow resistance was higher for small root crops with foreign bodies in a vertical direction than for the clean ones of the same size and airflow direction. Foreign bodies impede vertical airflow more than horizontal airflow. Foreign bodies increase the capacity density and decrease the texture of sugar beets. Hence, foreign bodies in piles of sugar beets have the greatest impact on airflow resistance. The presence of foreign bodies should be taken into consideration when choosing fans for the pile ventilation of sugar beets, as it influences the static pressure of the fan and evenness of the airflow.
Conclusions
- The consumption of air depends on pressure drop. Their interaction was described by two models used in this research, namely, model 1 and model 2. These models and estimated characteristics were used for estimating the static pressures of fans for the pile ventilation of sugar beets.
- The volume density and texture of sugar beet root crops influences airflow resistance. The higher the bulk density and lower the texture, the greater the airflow resistance. Thus, the fan needs a higher static pressure.
- Small root crops show a higher resistance to airflow compared to big and mixed root crops. The bulk density values of the small roots are higher than the values of the big and mixed ones.
- Because of the different bulk density during testing on the vertical and horizontal directions, the impact of airflow direction cannot be properly estimated.
- The presence of foreign bodies in piles has the greatest impact on airflow resistance. At low airflow speeds, foreign bodies increased airflow resistance as much as 6.8 times more than with clean root crops. At higher airflow speeds, airflow resistance increased as much as 2.6 times more than with clean root crops.